


Section on oceans of the WMO climate statement for 2013
The popular annual WMO climate statement for 2013 will -- for the first time -- include a section on oceans. CLIVAR, with its renewed focus on oceans and climate, will be working to further our understanding of, and ability to predict, these major changes.
OCEANS
The ocean acts as an effective buffer for the climate system by absorbing and storing a large amount of excess carbon and heat from the atmosphere. It has absorbed approximately one quarter of all the carbon dioxide (CO2) released into the atmosphere by humans since the start of the industrial revolution. This absorbed CO2 forms a week carbonic acid, which causes ocean acidification. As a result, the pH of the ocean has decreased by 0.11, which corresponds to approximately a 30% increase in acidity. Ocean acidification is already harming corals, shellfish and other marine life.
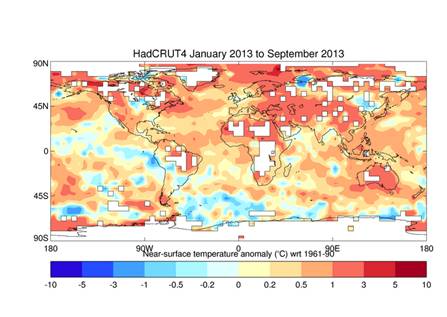
While the rate at which surface air temperatures are rising has slowed in recent years, heat continues to be trapped in the Earth system, mostly as increased ocean heat content. About 93 per cent of the excess heat in trapped in the Earth system between 1971 and 2010 was taken up by the ocean. From about 1980 to 2000, the ocean gained around 50 zettajoules (1021joules) of heat. Over the briefer and more recent period of 2000 to 2013, it added about three times that amount of heat. Prior to 2000, most of the heat was being trapped between the sea surface and a depth of 700 m. Since then, most of the heat is being trapped at depths between 700 and 2000 m. The increased uptake in this region may be due to changes in atmospheric and ocean circulation patterns in the tropical Pacific and to interactions with large-scale climate patterns such as ENSO and the Pacific Decadal Oscillation.
Globally, sea level has risen by 19 cm since the start of the 20th century, mostly because of the thermal expansion of the oceans and the melting of glaciers and ice caps. Since measurements began in 1993, sea level has been rising at about 2.9–3.2 mm/yr (based on two separate estimates, each with an uncertainty of ±0.4 mm/yr), with some year-to-year variability. This range encompasses the observed rate of about 3 mm/yr for the 2001-2010 decade and is around double the observed 20th century trend of 1.6 mm/yr.
Preliminary analyses indicate that the global average sea level reached a new record high during March 2013. Some regions of the globe are experiencing greater sea level rise than others (some even experience declining sea levels) due to local variations in currents, land movements and ocean warming (Figure 6). The region of the Pacific Ocean near the Philippines has observed some the highest rates of rise over the past half century. This contributed to the enormous devastation in parts of the islands when Typhoon Haiyan struck in November and caused a massive storm surge.