


Can ocean models reproduce the observed signature of water cycle intensification?
Global warming drives changes in the salinity and temperature of the ocean interior via modified air-sea fluxes of heat, freshwater and momentum. The Argo program provides an important source of observational data in the ocean interior that allowed recent studies to improve our understanding of the changes occurring (Gould et al., 2004). Durack and Wijffels (2010) and Durack et al. (2012) showed that the historically observed salinity trends demonstrate an amplification of the surface salinity pattern that is associated with an intensification of the atmosphere-ocean hydrological cycle. However, the relation between the observed changes at the surface of the ocean and the reported trends in the ocean interior is not fully understood. Our model study allows us to elucidate how our knowledge of surface changes impact on the interior of the ocean over a long timescale.
Recently, Lago et al. (2015) used the Australian Community Climate and Earth System Simulator – Ocean Model (ACCESS-OM: Bi et al., 2013) to decompose the surface temperature and salinity trends resulting from climate change to see if the observed response could be reproduced. ACCESS-OM is the ocean/sea-ice component of the ACCESS model submissions to CMIP5, has 50 vertical levels, and is nominally at one degree horizontal resolution with meridional grid refinements in the Southern Ocean (Mercator) and at the equator; and a tripolar grid in the Arctic. The mean global ocean surface temperature has warmed by about 0.5oC over the last 50 years (Rhein et al., 2013). The corresponding sea surface salinity pattern of deviations from the global mean has amplified by about 8% per 50 years (Durack et al., 2012). Lago et al. (2015) imposed idealized surface changes that simulate the increased air temperature and freshwater flux with linear trends over a 50 year period in the ACCESS-OM to identify the respective impact on the subsurface salinity field. The surface temperature and salinity are changed individually and together whilst keeping other fields fixed inter-annually with the CORE Normal Year Forcing (Large and Yeager, 2009) under the CORE experimental protocol (Griffies et al., 2009).
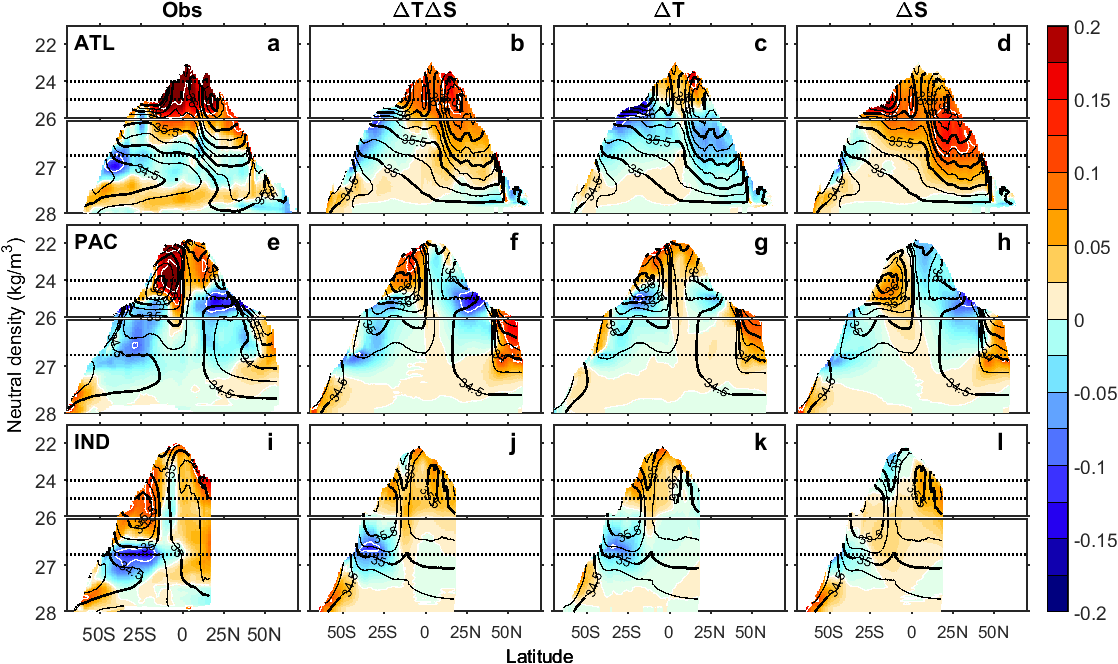
The subsurface salinity changes produced in the model qualitatively compare with the observed 50-year trends (Figure 1) and the model does reproduce the observed ocean interior watermass changes that were seen in hydrographic observations. The experiments are described in the figure as ∆T∆S for the combined effect of surface temperature and salinity change, ∆T for surface warming only and ∆S for surface salinity amplification only. Key features of the observed salinity changes are reproduced in these idealized experiments. The watermass salinity changes are reproduced through a combination of the effect of both surface changes in the temperature and salinity fields. The surface warming induces equatorward migration of outcropping isopycnals, which manifest as changes in salinity on density surfaces in the ocean interior. The decomposed effects of the modeled surface temperature and salinity changes on the salinity field superimpose and are linearly additive, when compared to the combined changes experiment, within the range of surface changes imposed. These results demonstrate that ocean circulation models are able to simulate interior changes caused by surface trends and suggests that in the presence of more ocean salinity data there is potential to estimate surface freshwater fluxes changes on long timescales.
Written by Véronique Lago, Simon Marsland, Paul Durack and Nathan Bindoff
Figure Caption: Zonally averaged salinity changes (PSS-78 per 50 years) on neutral density in the Atlantic (a, b, c, d), Pacific (e, f, g, h) and Indian (i, j, k, l) Oceans. The columns correspond from left to right to the observations, ∆T∆S, ∆T and ∆S. The white contours are the salinity trend every 0.1 PSS-78. The black contours are the mean salinity every 0.5 PSS-78 (thick lines) and 0.25 PSS-78 (thin lines). The dotted lines mark the σ=24 kg/m3, σ= 25 kg/m3 and σ=26.75 kg/m3 which we examine in more detail


Add new comment