


Atlantic Niños aren’t what they used to be
Atlantic Niños aren’t what they used to be
The Atlantic Niño is a climate variability pattern that was discovered in the 1970s and has been likened to El Niño. Just as we thought we had made good progress in understanding this phenomenon, it seems like it might go “extinct”, potentially due to climate change. Is the Atlantic Niño really going the way of the dodo, or is it merely taking a rest?
What are Atlantic Niños (aka AZMs)?
Atlantic Niño is the name given to warm events in the eastern equatorial Atlantic that occur once every several years. When we say “warm event” or “cold event”, we are principally talking about the sea-surface temperatures (SSTs), although these events extend far below the ocean surface. The name Atlantic Niño was coined in the 1980s and was inspired by its apparent similarity with the well-known El Niño phenomenon in the tropical Pacific. You may consider the Atlantic Niño to be El Niño’s little brother (maybe it should have been called “El Hermanito”?), as its geographical extent is smaller and its amplitude weaker than that of El Niño. And, just like El Niño’s opposite (i.e., cold events in the tropical Pacific) are called La Niña, cold events in the equatorial Atlantic are called Atlantic Niñas.
Personally, I prefer the term Atlantic zonal mode (AZM), partly because the analogy with El Niño only goes so far (see, e.g., here, or Richter and Tokinaga 2021), and partly because of the confusion that can arise from this terminology: Atlantic Niño (as well as El Niño) can refer to either warm events or to the phenomenon in general (i.e., both cold and warm events). Not to mention the havoc that the tilde in Niño can cause in some databases… But I digress.

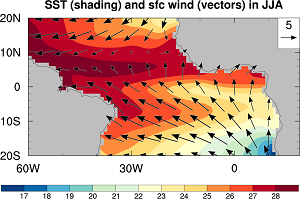
Figure 1. Average conditions in the tropical Atlantic during summer (June-August). The shading shows the sea-surface temperatures (SST; units are degree Celsius), the vectors show the surface winds (units are 5 meters per second). SSTs are from the OISST satellite observations and surface winds are from the ERA5 reanalysis.
To understand what happens during an AZM event, which is a departure from the climatological mean (i.e., the long-term average), one has to first understand the climatological mean itself (Fig. 1). The most important thing to note about the climatological SST during northern-hemisphere summer is the strong east-west gradient: SSTs are a warm 28 degree Celsius in the west but a fairly chilly 24 C in the east. Why is this the case, even though the sun is equally strong on both sides of the equatorial Atlantic (at least when it enters through the top of the atmosphere)? To answer this question, we look at what the surface winds are doing. Typically, the surface winds over the equatorial Atlantic blow from east to west (Fig. 1), and thus warm water masses are pushed westward and pile up along the South American coast. Put simply (and not entirely correctly) the water masses that are pushed away from the eastern equatorial Atlantic are replenished by cool subsurface water that is brought to the surface (a process called upwelling). In a way, you could consider this the equatorial Atlantic’s air conditioning.
During some years, the easterly winds weaken, which in turns weakens the oceanic circulation along the equator, and also weakens the upwelling and cooling. As a result, SSTs in the eastern equatorial Atlantic become warmer than normal (typically by about 1 degree Celsius); somebody has turned the AC a few notches down. This results in a warm AZM event (or an Atlantic Niño, if you prefer that terminology). Likewise, during some other years, the easterly winds strengthen, which leads to cooler than normal SSTs in the eastern equatorial Atlantic (somebody has cranked up the equatorial Atlantic AC). This is called a cold AZM event (or Atlantic Niña).

Figure 2. Departure of SST from the climatological average (i.e., SST anomalies) during the summer of 1988 (June-August). The SST are from the OISST satellite observations. This was a relatively strong warm event (a warm AZM event or Atlantic Niño). The blue box denotes the ATL3 region, where the events tend to be strongest. The area average of SST anomalies over this region is often used to characterize the state of the equatorial Atlantic and is called the ATL3 index.
The decline of the AZM
Relatively reliable SST reconstructions extend several decades back. While the AZM was not known in the 1950s and 1960s, in hindsight we can see that some of the strongest events occurred during those decades (Fig. 3). Particularly the 1963 positive AZM event stands out: with its amplitude of 1.5 C and duration of almost a year, it had El Niño-like proportions. While not quite at the level of the “wild 60s”, the AZM remained very active into the 1990s. From the new millennium onward, however, there was a marked decline in variability. Several studies have documented this decline in AZM variability over the last decades (Tokinaga and Xie 2011; Prigent et al. 2020; Richter and Tokinaga 2021; Silva et al. 2021; Richter et al.2022).

Figure 3. Time series of the ATL3 index (i.e., the area average of SST over the box shown in Fig. 2). The data are from the HadISST observations. The linear trend due to global warming has been removed before plotting. The strongest warm AZM event in this record is the 1963 event. From 2000 until the end of 2019 there is a marked decline in variability.
What is the reason for this decline? Well, it seems that global warming could have a role in this. It may seem that warmer mean temperatures should also mean warmer AZM events, but we have to remember that the AZM (like El Niño) is defined relative to the mean state. So, while the eastern equatorial Atlantic may get warmer under global warming, the year-to-year departures from this warmer mean state (i.e., the AZM) is projected to weaken by current climate change projections, as recently shown by two back-to-back articles in Nature Climate Change (Crespo et al. 2022; Yang et al. 2022). According to those papers, the general stabilization of the tropical atmosphere and ocean under global warming (a robust projection of climate models) will weaken the coupled ocean-atmosphere feedbacks that are necessary to produce long-lived strong AZMs by the end of the 21st century.
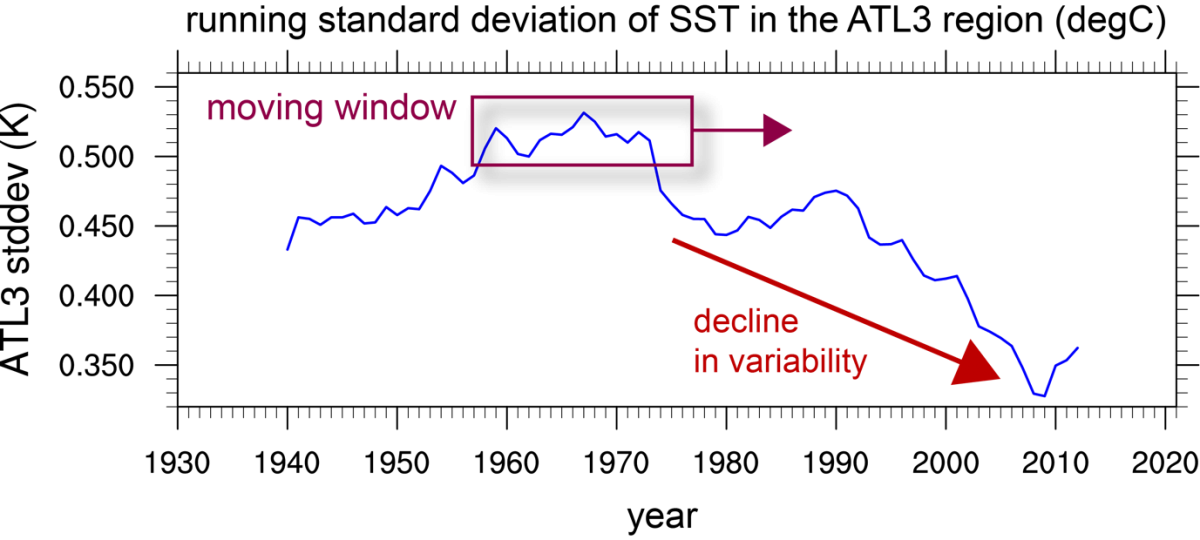
Figure 4. The decline in AZM activity from the 1970s. The standard deviation (a measure for the strength of variability) of the ATL3 index (see Fig. 2) is calculated over a 20-year window. This 20-year window is then moved through the HadISST data record, from 1930 through 2022. The values that result from this procedure are shown by the blue curve. The decline in recent decades is obvious.
While the ~50 models in the latest round of the IPCC report agree fairly well on the weakening of the AZM under global warming, there are two important questions:
1) Are these models right?
2) If they are, is the recent AZM decline really due to the greenhouse gas impact (which is still in its early stages) or due to something else?
The AZM returns
For most of the 2000s and 2010s the AZM showed only weak activity. 2019, however, was marked by a very strong warming event (Figs. 3 and 4; Richter et al. 2022). In fact, it may have been the strongest event in about 40 years, depending on which observational dataset you look at. Not only was it exceptionally strong, it also occurred during an unusual time of the year. Typically, the AZM develops in northern-hemisphere spring (that is, March-May) and peaks in summer (June-August), but the 2019 warm AZM developed much later in the fall. While these kind of late fall events have been documented (Okumura and Xie 2006; Valles-Casanova et al. 2020), they tend to be much weaker than the ones in summer.
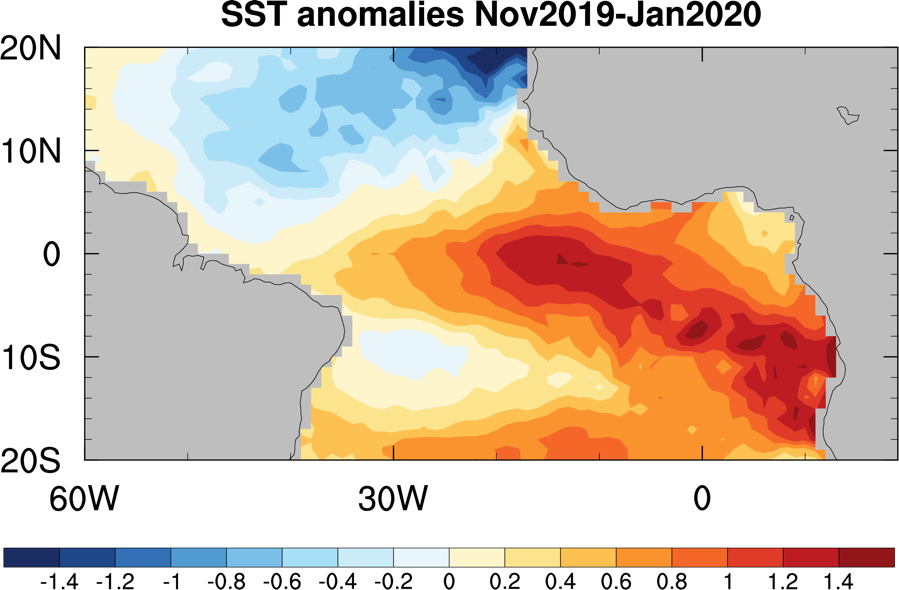
Figure 5. Like Fig. 2 but for the 2019/2020 warm AZM event. This was potentially the strongest warm event since 1980.
So the 2019 event stood out because,
1) It punctuated a 20-year period of low activity.
2) It was very strong, possibly the strongest warm AZM event for which we have satellite observations of SST (which started from about 1980).
3) It occurred during an unusual time of the year.
It was even more remarkable that another (near) record-breaking warm AZM event developed in the summer of 2021, less than 1 1/2 years after the 2019 event. While AZM events do have a tendency to recur (e.g., 1998 and 1999, or 1987-1989), a double-peak of this magnitude has not seen in the last 70 years or more.
In a way, it feels like the preceding 20 years of inactivity were the calm before the storm. To put it more scientifically, could it be that there was a gradual build-up of ocean heat content during the period 2000-2019? This would imply a subsurface warming, possibly down to 100 meters below the ocean surface. It is not easy to verify this since subsurface observations are limited, particularly off the equator. My own analysis suggested a gradual build-up of ocean heat content along the equatorial Atlantic from about 2016 through mid-2019 (Richter et al. 2022). This is quite a long period, but far shorter than the 20-period of inactivity we are talking about. It is possible, however, that the build-up of heat started much earlier, away from the equator. Hopefully, someone will take a closer look at this in the near future.
Where do we go from here?
Were the 2019 and 2021 events just a little blip in the slow demise of the AZM, or perhaps a sign of a trend reversal? With the limited data we have, it is hard to tell. It would seem, however, that the decline of AZM activity from 1980-2019 was too rapid to be just a consequence of global warming, at least if we trust the model consensus. According to the CMIP6 models, it will take until the end of the current century for variability to decrease from 0.5 C to 0.4 C (measured by the standard deviation of the ATL3 index), even for the worst-case scenario of greenhouse gas increases (Fig. 6). Roughly speaking, it would take almost a tripling of CO2 concentrations to decrease the AZM variability by 20%. But the observed decline from 1980-2019 was larger than that (about 0.15 C, or 30%), even though CO2 increased by only ~20% over that period. The exact numbers are debatable, but it is clear that observed CO2 changes were far too weak to account for the observed decrease in variability – at least if the models are anywhere near the true sensitivity. It is therefore more likely that the recent decline is mostly due to other forcings, such as those from aerosols (Tokinaga and Xie 2011), or due to natural multi-decadal variability, such as that associated with the AMOC.
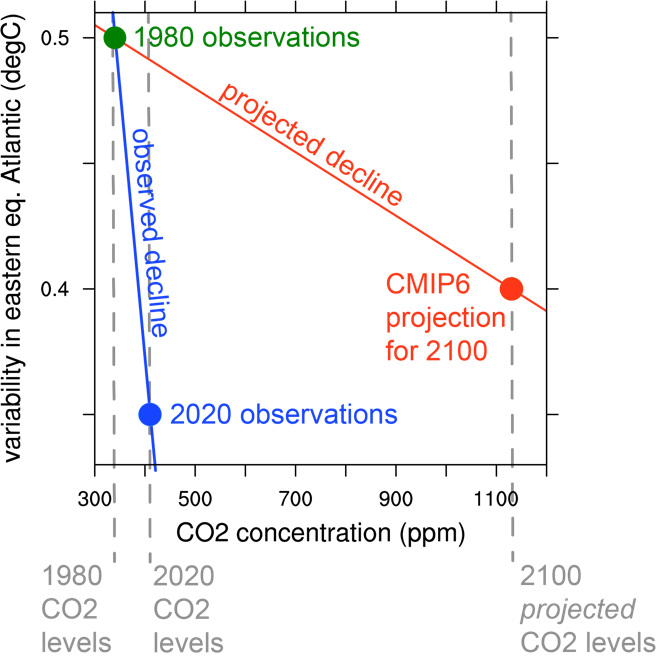
Figure 6. Observed and projected decline in equatorial Atlantic SST variability. All numbers are rough estimates. The horizonal axis shows the atmospheric CO2 concentration (in parts per million, or ppm), a measure of the greenhouse gas forcing on the climate. Since CO2 has increased with time, and is projected to do so in the climate simulation, it is also an indicator of time, as marked by the dashed vertical lines: 340 ppm corresponds to 1980, 410 ppm to 2020, and ~1150 ppm to the year 2100. Note that the last value is based on the most pessimistic emission scenario (ssp585). The vertical axis shows variability in the eastern equatorial Atlantic, as estimated by the running standard deviation in the ATL3 region shown in Fig. 4. The three dots show the 1980 observations (green), 2020 observations (blue), and the projection for 2100 (red).
While the cause of the decline in AZM variability (and its sudden flare-up in 2019 and 2021) remain unclear, it will be interesting to monitor the equatorial Atlantic over the next several years. In particular, we need to maintain our existing in-situ observation network to monitor ocean state changes below the surface and how those changes affect SST variability.
Personally, I haven’t written off the AZM just yet.
(Blog written by Dr. Ingo Richter)
References
Crespo, L. R., A. Prigent, N. Keenlyside, S. Koseki, L. Svendsen, I. Richter, and E. Sanchez-Gomez, 2022: Weakening of the Atlantic Niño variability under global warming. Nat. Clim. Chang. 12, 822–827. https://doi.org/10.1038/s41558-022-01453-y
Okumura, Y., and S.-P. Xie, 2006: Some overlooked features of tropical Atlantic climate leading to a new Niño-like phenomenon. Journal of Climate, 19, 5859– 5874. https://doi.org/10.1175/jcli3928.1
Prigent, A., Lübbecke, J. F., Bayr, T., Latif, M., & Wengel, C. (2020). Weakened SST variability in the tropical Atlantic ocean since 2000. Climate Dynamics, 54, 2731– 2744. https://doi.org/10.1007/s00382-020-05138-0
Richter, I., & Tokinaga, H. (2021). The Atlantic zonal mode: Dynamics, thermodynamics, and teleconnections. In S. K. Behera (Ed.), Tropical and extratropical air-sea interactions. Elsevier. https://doi.org/10.1016/b978-0-12-818156-0.00008-3
Richter, I., Tokinaga, H., & Okumura, Y. M. (2022). The extraordinary equatorial Atlantic warming in late 2019. Geophysical Research Letters, 49, e2021GL095918. https://doi.org/10.1029/2021GL095918
Silva, P., I. Wainer, and M. Khodri, 2021: Changes in the equatorial mode of the Tropical Atlantic in terms of the Bjerknes Feedback Index. Clim. Dyn., 56, 3005-3024. https://doi.org/10.1007/s00382-021-05627-w.
Tokinaga, H., and S. P. Xie, 2011: Weakening of the equatorial Atlantic cold tongue over the past six decades. Nature Geosci 4, 222–226. https://doi.org/10.1038/ngeo1078
Vallès-Casanova, I., S.-K. Lee, G. R. Foltz, and J. L. Pelegrí, 2020: On the spatiotemporal diversity of Atlantic Niño and associated rainfall variability over West Africa and South America. Geophysical Research Letters, 47, e2020GL087108. https://doi.org/10.1029/2020GL087108
Yang, Y., L. Wu, W. Cai, F. Jia, B. Ng, G. Wang, and T. Geng, 2022: Suppressed Atlantic Niño/Niña variability under greenhouse warming. Nat. Clim. Chang. 12, 814–821. https://doi.org/10.1038/s41558-022-01444-z


Add new comment