


About Atlantic
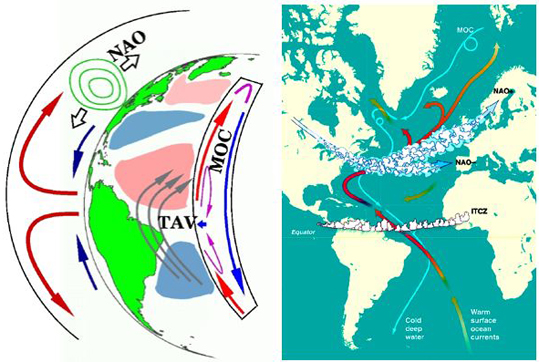
Modes of Climate Variability in the Atlantic Sector. The figure on the right shows the path and strength of winter storms depending on the sign of the NAO; the location of tropical rainfal (determined by the ITCZ); and the transport of the ocean currents (MOC). Blue arrows:cold, deep currents; red arrows:warm surface currents (source: M. Visbeck, 2002; Science 297, 2223-2224).