


Organization
Scientific Steering Group
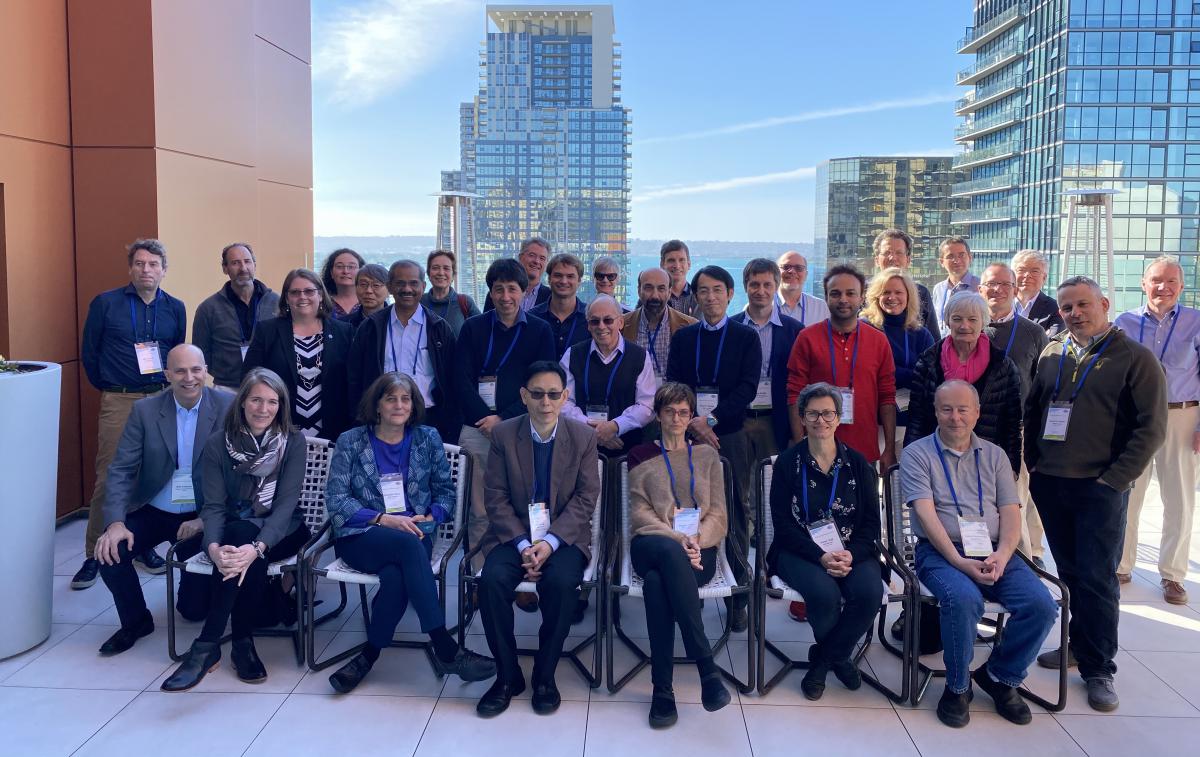
The Scientific Steering Group (SSG) is a select group of scientists that oversees the implementation of CLIVAR science and reports progress to the Joint Scientific Committee (JSC) of the World Climate Research Programme (WCRP). The members of the SSG are all leaders in their respective fields, which are relevant to CLIVAR science. The scientific expertise of the SSG covers all CLIVAR research areas. Membership of the SSG is rotated; initial terms of service are for two years. However, extension beyond this timeframe is possible. The CLIVAR SSG meets annually and includes members of the SSG and representatives of each of the CLIVAR panels (typically panel chairs).
Organization Diagram
International CLIVAR Project Office
The International CLIVAR Project Office (ICPO) is responsible for the co-ordination of the scientific and administrative aspects of the CLIVAR programme, under the oversight of the SSG.