


Recommendations from CLIVAR basin panels - Pacific
The CLIVAR basin panels have been asked to provide WGOMD with input on ocean metrics to evaluate model performance in terms of ocean processes occurring in the different ocean basins. Return to main REOS Metrics page.
 |
 |
 |
 |
Metrics for the Pacific Ocean
Includes input from the CLIVAR Pacific Implementation Panel
Mean State
--Depth of 20ºC isotherm (often referred to as Z20) equatorward of 20ºN/S compared to PMEL TAO/TRITION. State of Z20 is related to the tropical SST and thus its reproducibility may affect amplitudes of climate variability such as ENSO and IOD.
--Time-series of "top-700m" and "top-3000m" heat content averaged over tropical, subtropical Pacific and whole Pacific compared to the World Ocean Atlas (Levitus).
--Section along the Equator: zonal currents (SEC, Equatorial under current, Equatorial intermediate current), temperature (thermocline), salinity (barrier layer).
--Comparison with WOCE meridional sections
P10 (149ºE): North Pacific Subtropical Mode Water, Kuroshio Extension latitude/strength.
P14 (179ºE): North Pacific Intermediate Water, Equatorial Currents (SEC, Equatorial Under Currents, Tsuchiya Jets, …).
P16 (150ºW): North Pacific Intermediate Water, Shallow Salinity Minima of the North Pacific, Antarctic Intermediate Water, Subantarctic Mode Water, Upper/Lower Circumpolar Deep Water, Equatorial Currents (SEC, Equatorial Under Currents, Tsuchiya Jets, …).
--Comparison with WOCE zonal sections
P3 (24ºN): North Pacific Subtropical Mode Water, North Pacific Intermediate Water, North Pacific Tropical Water.
P6 (32ºS): Antarctic Intermediate Water, Upper/Lower Circumpolar Deep Water.
--Comparison of sea level for different latitudinal bands as time-longitude diagrams with altimeter data and the sea level data compiled by the University of Hawaii Sea Level Center.
--Sections of temperature and salinity along XBT lines, line P
--Sections of temperature and salinity along the "A-line" (http://www.hnf.affrc.go.jp/a-line/intro/index_e.html)
ENSO Metrics
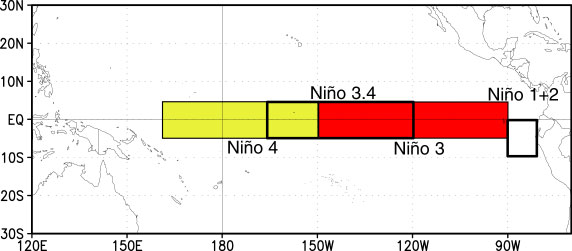
Niño Regions to monitor the Tropical Pacific
- Niño 1: 80W-90W and 5S-10S.
- Niño 2: 80W-90W and 0S-5S
- Niño 3: 90W-150W and 5S-5N.
- Niño 3.4: 120W-170W and 5S-5N.
- Niño 4: 160E-150W and 5S-5N.
Download a Pacifc Implementation Panel poster of proposed metrics to evaluate coupled model performance in the Tropical Pacific here that addresses the following:
- ENSO and instability
- ENSO and the mean state
- ENSO and intraseasonal variability
ENSO and tropical Pacific metrics for coupled GCMs
Proposal by the ENSO metrics work group of the CLIVAR Pacific Panel (Sept. 2008)
See Wittenberg et al. (2006) for a comprehensive evaluation of the Tropical Pacific and its variability. Wittenberg (2009) evaluates the interdecadal and intercentennial modulation of its ENSO behavior in a 2000 year run of the GFDL CM2.1 global coupled model.
van Oldenborgh et al. (2005) and Guilyardi E. (2006) specifically look at ENSO in the CMIP3 models. Guilyardi et al. (2009) is a BAMS review of ENSO in GCMs. A review on ENSO and climate change is in preparation (M. Collins is leading this).
Website on ENSO Metrics for coupled models
This website is hosted by LOCEAN IPSL and has been compiled by E. Guylardi, M. Fortin and K. Aradj. The ENSO Metrics are arranged according to:
1. Mean State (in addition to mean fields given above, here focusing on the Indo-Pacific Tropics)
--Root Mean Square (RMS) of the difference of SST mean map in Indo-Pacific domain & Tropical Pacific with the reanalysis ERA40.
--RMS of the difference of SST in Nino 3 & Nino 4 with ERA40
--RMS of the difference of Zonal Wind Stress mean map in tropical Pacific with ERA40
--RMS of the difference of Zonal Wind Stress mean map in Tropics & Indo-Pacific with ERA40
--RMS of the difference of Precipitations mean map in Tropics, Indo-Pacific, & equatorial Pacific with CMAP
--RMS of the difference of Net Surface Heat Flux mean map in Nino 3 with OAFLUX
--Difference of the mean zonal Heat Content of [0-300]m along the equatorial Pacific with PMEL T300. The zonal heat content of [0-300]m is the mean temperature of the [0-300]m along the equatorial Pacific (5°N-5°S 120°E-80°W)
--Difference of the mean Warm Water Volume with PMEL WWV. The Warm Water Volume represents the volume along the Pacific equatorial band (5°N-5°S 120°E-80°W) of water with temperature warmer than 20°C.
2. Annual Cycle
--Difference of standard deviation of annual cycle of SST in Nino 3 with ERA40
--Difference of standard deviation of annual cycle of Zonal Wind Stress in Nino 3 with ERA40
3. ENSO Strength
--Difference of standard deviation of SST anomalies (SSTA) in Nino 3 with ERA40
--Difference of standard deviation of SST anomalies in Nino 4 with ERA40
--Difference of standard deviation of precipitations anomalies in Nino 4 with CMAP
--Error on the zonal Heat Content of [0-300]m standard deviation along the equatorial Pacific in relation to PMEL T300
--Error on the Warm Warm Volume standard deviation in relation to PMEL WWV
--Difference of standard deviation of Zonal Wind Stress anomalies in Nino 4 with ERA40
4. ENSO Frequency
--RMS of the difference of normalized spectra in Nino 3
Correleation coefficients between the different metrics are presented and metrics are compared with between a 20th Century and a pre-industrial simulation. A list of models and data used for the analysis is given. A list of the order of importance of these ENSO Metrics is also given.
Please refer to REOS Datasets for links to data.
Decadal variability
--The first principal component of SST for the Pacific Ocean north of 20ºN. This is a proxy for Pacific decadal variability (Tanimoto et al., 1993).
--Upper layer heat content (averaged temperature in upper 400m) for the western North Pacific (30ºN-45ºN, 140ºE-180º). This is another proxy for Pacific decadal variability (Nonaka et al., 2006; Taguchi et al. 2007).
--Pacific Decadal Oscillation (PDO) Index (as defined by Mantua et al., 1997, Zhang et al., 1997)
Derived as the leading PC of monthly SST anomalies in the North Pacific Ocean, poleward of 20N. The monthly mean global average SST anomalies are removed to separate this pattern of variability from any linear trend that may be present in the data.
Trends
--Linear trend in temperature and salinity of the zonally averaged temperature and salinity for the whole basin. This could be compared with Levitus et al. (2005) and Boyer et al. (2005).