


WCRP/IOC Sea Level Conference: Day 1 Highlights
Scientists begin conference on sea level change, starting with the past and working towards the future
The significance of rising waters in New York City was evident during Hurricane Sandy and on 10 July 2017 when hundreds of scientists gathered at Columbia University to kick-off a week long Regional Sea Level Changes and Coastal Impacts Conference. The international conference — organized by the World Climate Research Programme (WCRP), CLIVAR, and the UNESCO Intergovernmental Oceanographic Commission —has a stated vision to be:
A collective voice and expertise of the international sea level community to address existing challenges in describing and projecting regional and coastal sea level changes, and in quantifying intrinsic uncertainties.
Day one of the conference began with high-profile remarks on the societal importance of addressing sea level changes. “We have a special responsibility to help society respond to the climate issue. We need to develop smart, end-to-end, climate information systems of basic research to climate services,” said Guy Brasseur, Chair of the WCRP. Science-based information can help decision makers and stakeholders better prepare for the impacts of sea level rise through adaptation and coastal management. Brasseur suggested that the community develop a robust sea level budget.
When talking about sea level, we should be thinking about an integrated system. “Sea level is an integrated quantity of many of climate indices,” said Detlef Stammer, University of Hamburg and co-chair of the Conference Scientific Organizing Committee.
The US East Coast has some of the highest projected sea level increases. Pointing out that Manhattan is an island and lies within a few feet of sea level, Michael Purdy, Executive Vice President for Research at Columbia University, emphasized that the rate at which we are increasing our understanding and the rate of our actions are insufficient.
Globally, sea level is just as much a threat. Many low-lying nations see their sovereignty at risk. “As global temperatures inexorably rise, desertification spreads, the Arctic melts, and islands submerge, we are confronted by powerful forces who deny that any of this is actually happening, or that if it is happening it is not for the anthropogenic reasons identified by scientific consensus,” said H. E. Peter Thomson, President of the 71st Session of the General Assembly.
Sea level rise will not stop at the end of the 21st century but will continue for many centuries.
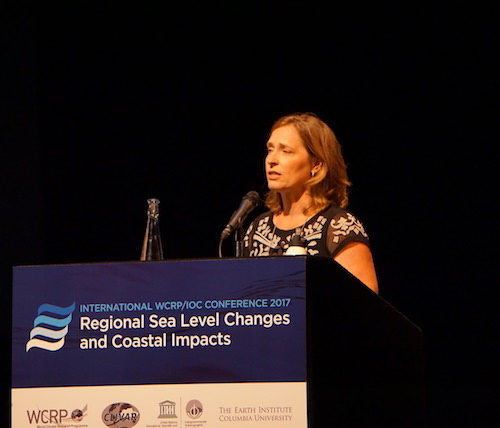
“Humankind is pushing ever harder against our planetary boundaries. These impacts are becoming more stronger every day,” stated Peter Schlosser, Associate Director of the Earth Institute. Which is why the next Intergovernmental Panel on Climate Change (IPCC) assessment (AR6) is pressing. The IPCC AR6 will give governments the scientific, technical, and socio-economic information relevant to understanding the scientific basis of risk of human-induced climate change, its potential impacts, and options for adaptation and mitigation. Specific to sea level rise, Valerie Masson-Delmotte, co-chair of the IPCC Working Group 1, shared how in the last decade over 4000 peer review papers were published with “sea level” in the title. She also presented the IPCC AR6 schedule, which includes a special report on 1.5°C of global warming (scheduled for release in Fall 2018) and an oceans and cryosphere special report (schedule for release in Fall 2019), both of which will discuss the latest science of sea level rise.
The opening session also included overview talks that set the stage for the six conference sessions. Highlights include:
- Scientists are improving the closure of the sea level budget, but there is still significant uncertainty on all components. While modeled sea level changes are increasingly representing regional variability, some big challenges remain, such as accurately estimating ocean heat uptake in the deep ocean and under the ice. (John Church, University of New South Wales)
- There is room for huge advancements in the rate and locations of understanding historical paleo records. For example, deformation of Orangeburg scarp (located in South Carolina) is not simply glacial isostatic adjustment. Dynamic topography causes non-horizontal shorelines – a few meters over 100,000 years. (Maureen Raymo, Lamont-Doherty Earth Observatory)
- Ice sheets are responding to the ocean, and if we want to understand ice sheets, then we need to understand regional climate change. High-end projections of sea level change are harder than the ‘most likely’ outcomes because many processes that control mass loss are highly localized. Recent increases in ice flow are due to ocean circulation changes and may involve natural variability. (Tony Payne, University of Bristol)
- Governments should take a metropolitan regional approach to city adaptation with a response structure across sectors and communities. New York was used as an example, which has its own panel for climate change that addresses resilience with a “portfolio approach” that combines policy, engineering, social action, and ecosystem based solutions. As with physical processes, there are tipping points in community response, such as lost homes. (Cynthia Rosenzweig, NASA GISS)
Following the opening session were three sessions on paleo sea level data and modeling, millennial-scale ice sheet and sea level interactions, and contemporary contributions from ice sheets and glaciers. Below are some highlights:
- Scientists need to take crustal dynamic topography into account when looking at geological evidence of paleo sea level, which could significantly affect regional sea level on shorter timescales. Additionally, there is globally consistent evidence for an ephemeral fall followed by a rise of a few meters about 125,000-126,000 years ago (during the last interglacial period). (Andrea Dutton, University of Florida)
- Scientists can reconcile observations of paleo glacial isostatic adjustment following the Last Glacial Maximum in North America using 3D visco-elastic solid Earth modeling. Seismic data confirms low upper mantle viscosity along the US West Coast, with substantial spatial variation. This new result gives confidence in improved glacial isostatic adjustment corrections that are applied to tide gauge data. (Jerry Mitrovica, Harvard University)
- Using POLENET, GPS and seismometer data show the Amundsen Embayment of the West Antarctic Ice Sheet has a very low upper mantle viscosity with large spatial variability and some very localized crustal deformation. These results suggest that the ‘corrected’ GRACE data may be significantly underestimating contemporary mass loss from this very dynamic region. (Terry Wilson, Ohio State University)
- New marine sediment cores from the Mid-Pliocene (3-3.2 million years ago) produce a time series of relative sea level, suggesting the Antarctic Ice Sheet had rapid melt and re-growth of 20 m sea level equivalent in approximately 20,000 year cycles. (Georgia Grant, Victoria University of Wellington)
- A 3D Earth structure is important to accurately model sea level and ice sheet feedbacks, and the recent (last millennia) ice history is vital for making accurate predictions of ice sheet evolution. (Natalya Gomez, McGill University)
- Increased understanding of grounding line dynamics and high-resolution models reduce uncertainties in the marine ice sheet instability contribution to sea level rise. (Frank Pattyn, Université libre de Bruxelles)
- Glaciers will be a significant contribution to sea level rise in the next century and beyond. While there are a relatively small amount of glacier modeling efforts (only 7 in last 15 years), results show that at least 50% of all glacier volume will still be present by 2100. (Regine Hock, University of Alaska, Fairbanks)
- Observations with sufficient spatial and temporal sampling are available to allow for data assimilation in ice sheet dynamical modeling (Patrick Heimbach, University of Texas at Austin)
- The wind direction drives ocean heat transport, which influences sub-ice shelf melting, sea ice volume, and resulting sea level contribution. (Gustavo Marquez, Princeton University/NOAA GFDL)
- Comparing last interglacial modeling results with pre-industrial modeling results — both of which have similar greenhouse gas emissions — the whole periphery of the Greenland Ice Sheet shows much more melt than the current day, particularly in the west of Greenland. (Bette Otto-Bliesner, National Center Atmospheric Research)
Follow along at #SeaLevel2017 and stay tuned for more conference daily highlights. Also, look for updates in the conference website: sealevel2017.org